Hundreds of wells analysed globally
New Zealand Australia Timor North/South America Norway North Sea Oman Angola Kenya Myanmar India Pakistan Indonesia Brunei Malaysia Thailand Papua New Guinea Brazil
Incident light, Oil Immersion.
What is the difference between VIRF and standard VR?
Vitrinite reflectance analysis (VR) was first developed specifically as a method to characterise coal rank. Vitrinite is derived from the cellular tissues of plants, and is relatively easy to identify in coal, because it occurs in context with other organic constituents and has a well defined morphology.
In the polished section shown, two coals have been mounted side by side. The coal on the left has a VR of 1.8% the coal on the right has a VR of 0.6%
A major problem for VR of dispersed organic matter in sedimentary rocks is unreliable identification of vitrinite. This is because many subjects have ambiguous morphology, and identification of vitrinite is highly subjective.
As an example, many analysts would identify the subject shown on the right as vitrinite. However, the sample is a Cambrian oil shale that was deposited long before land plants began to evolve.
Incident light, Oil Immersion
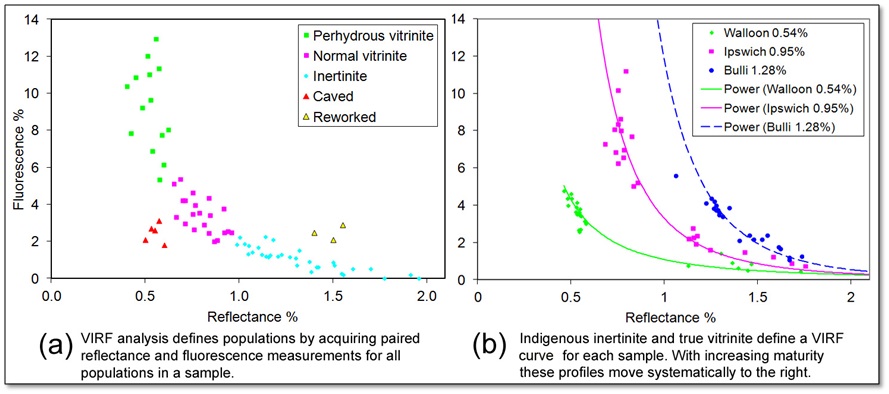
VIRF (vitrinite-inertinite reflectance and fluorescence) takes the guesswork out of vitrinite identification, by measuring both the reflectance and the fluorescence of each subject. VIRF distinguishes "normal" (orthohydrous) vitrinite from inertinite, and also from perhydrous (suppressed) vitrinite, cavings, and reworked vitrinite. Maturity is expressed as Ro (normal), the average of measurements on indigenous normal vitrinite.
Fluorescence is measured quantitatively and in a nitrogen atmosphere, which prevents ‘alteration’ (changes in fluorescence intensity during exposure to UV).
Comparison of VR and VIRF maturity data for Clipper-1 in the Canterbury Basin shows that standard VR from two laboratories has seriously underestimated source rock maturity. VIRF suggests that the VR analysts who originally analysed samples from Clipper-1 selectively measured caved and perhydrous vitrinite. Indigenous vitrinite with normal chemisty was likely assigned to inertinite or reworked vitrinite.
VIRF defines a complex maturity profile for the Clipper-1 well (Canterbury Basin, New Zealand). This is attributed to hydrothermal activity driven by igneous intrusion.
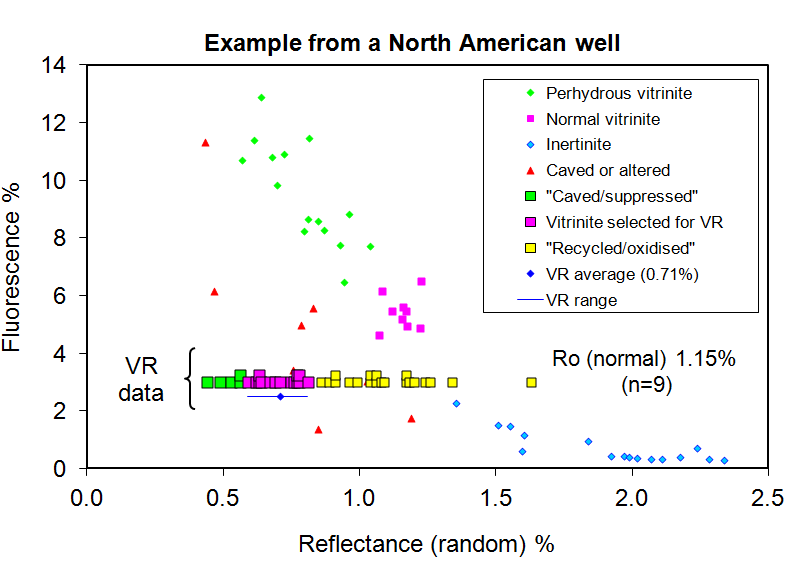
In this North American sample the VR analyst classified their measurements into perhydrous vitrinite, normal vitrinite, and inertinite based on a subjective assessment of morphology, resulting in a VR value of 0.71%. VIRF analysis provides Ro (normal) 1.15%, and reveals that the VR analyst has attributed vitrinite of normal chemistry to inertinite, resulting in a reflectance value that is more than 0.4% too low.
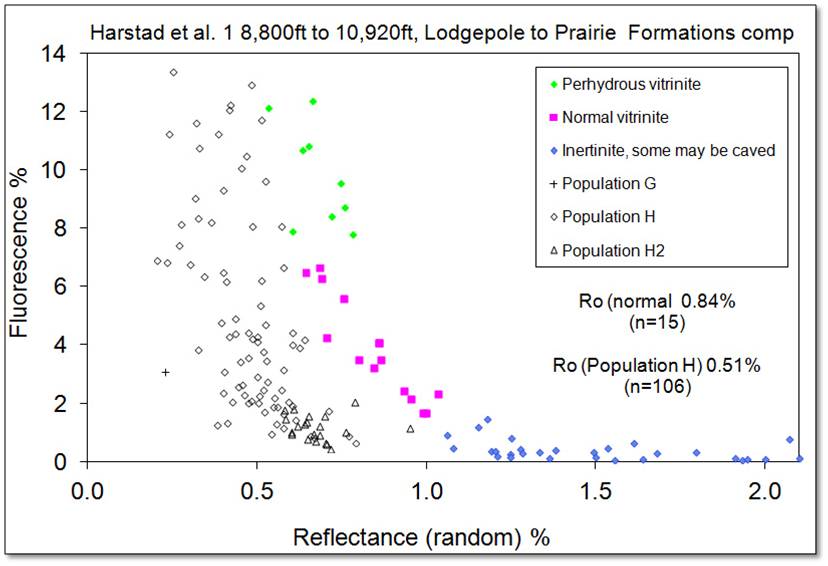
The analytical resolution provided by VIRF analysis also allows complex organic populations to be differentiated. For example, VIRF has revealed the existence of “Population G/H” in high TOC dark shales from Devonian to Cretaceous age. Population G/H has the same morphology as vitrinite but it is derived from an unrelated source and is compositionally distinct from true vitrinite.
In mature samples the reflectance of Population G/H is 0.3% lower than Ro (normal) measured on true vitrinite in the same sample (Newman et al 2013). High TOC dark shales often contain relatively little or even no true vitrinite, and VR analysts routinely report reflectance values measured on Population G/H, resulting in serious underestimation of source rock maturity.
The VIRF chart in the example below represents data for the Upper, Middle and Lower Bakken Formation. The Bakken Formation is an unconventional play where the same rock unit is both the source and the reservoir. This chart clearly distinguishes Population G/H (Ro 0.58%) from true vitrinite (Ro normal 0.86%). This is crucial information, because it shows that the sample has achieved maturity for hydrocarbon generation, whereas reflectance measured on Pop G/H classifies the sample as immature.

Fig.4 from Newman, J., J. D. Edman, J. A. LeFever, J. Howe, 2013. Parshall Field: Inferences from new data regarding Bakken hydrocarbon generation and migration (extended abs.): 2013 Unconventional Resources Technology Conference, #1578764. (Photomicrographs are incident light oil immersion)